Shipping Corporation Of India [SCI] is a leading Shipping Company in India and the most interesting thing is, it is under the control of Indian Government. Shipping Corporation of India was started wayback in the year 1961 [ October 2nd] and is headquartered at Mumbai. Undeniably, one of the Oldest shipping companies in India.
One of the largest public sector company which specializes in operating and managing vessels services, national and international Lines. Government of India has major share in this company, so we can say that SCI is owned by Indian Government. Its administrative control was under Ministry of Ports, Shipping and Waterways.
Jayanti Shipping Company and Mogul Lines Limited were two famous shipping companies during 1970’s and 80’s. Both of these companies were merged with SCI in the year 1973 and 1986.
We have come up with another All Time High Breakout Stock. In this blog post we will discuss more about SCI share All Time High Break out Pattern on Monthly and Weekly chart. Based on the chart pattern we will predict or forecast Shipping Corporation of India share price Target for the year 2024 & 2025.
Shipping Corporation of India share price Breakout on Monthly Chart
Below image is the monthly chart of SCI Share. Just look at it once, before reading the article. If possible open tradingview.com or any other terminal on your laptop browser. Search for Shipping Corporation of India and open the chart on monthly Time Frame. As we have already said in our previous articles, on Monthly and Weekly Time frames you won’t see the intraday noise [ small movements in the stock]. So whoever is planning create fortune through Stock market, go for higher time frames.
Note : We are not suggesting any one to buy SCI share. Don’t buy stocks based on other opinions. Do your own analysis before buying the stock.
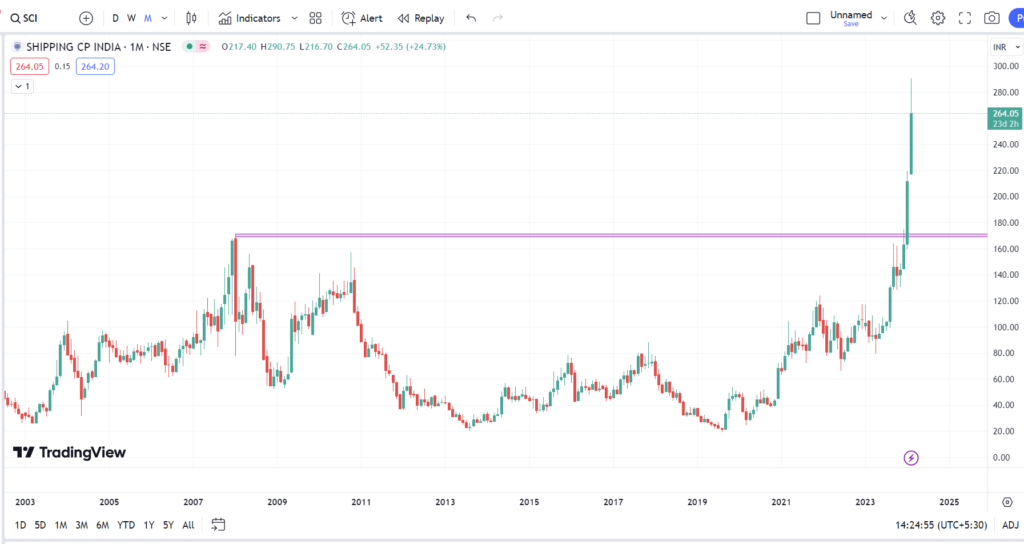
In the month of February 2008 SCI stock has registered all time high of Rs 177.6
In the 2008 Stock market crash happened , which had clearly impacted the stock rally. From 2008 onwards stock has seen terrible downside rally and stock took support at Rs 20 [ Which was all time low price after 2008 ] in 2013.
From 2013 to 2021 stock has been in consolidation mode [ its like rangebound ]. After corona pandemic , we witnessed good rally in SCI Stock. SCI share has given multiple opportunities to buy, which we will discuss in our next article.
In this article we will confine to “SCI Share All time high Breakout Strategy”.
After 2008 Stock has never came near to all time high Price Rs 177.6 till 2023 eneding.
Look at the below image, for clear understanding.
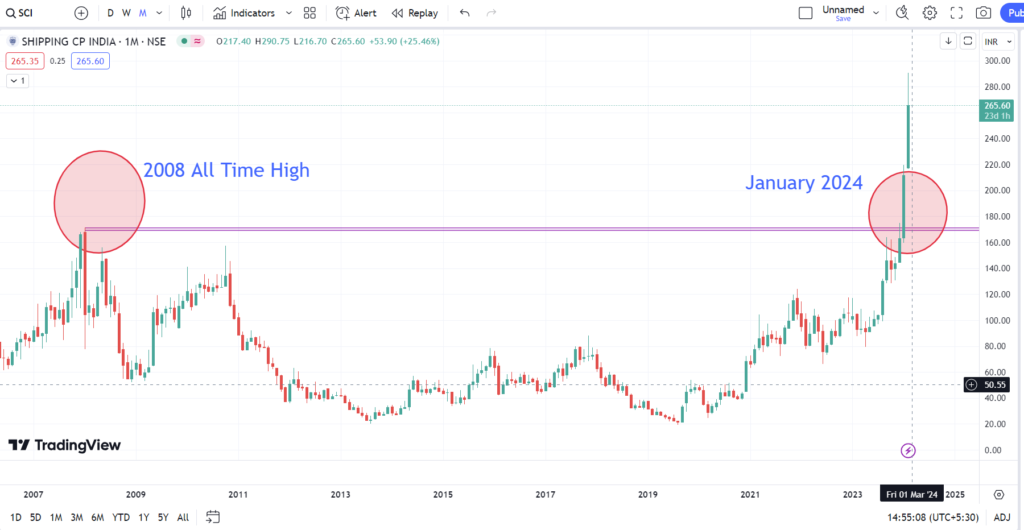
Above chart is in Monthly Time Frame.
In the month of January 2024, SCI Stock has broke all time high price and registered new high price of Rs 219.6.
Most important thing to look at is, January month candle closed above the previous all time high price [ 2008 high price].
If you are a regular follower of our blog, then we are sure you guys already know about the entry and exit points.
Anyway lets see complete details on SCI Stock entry price and exit price after breakout.
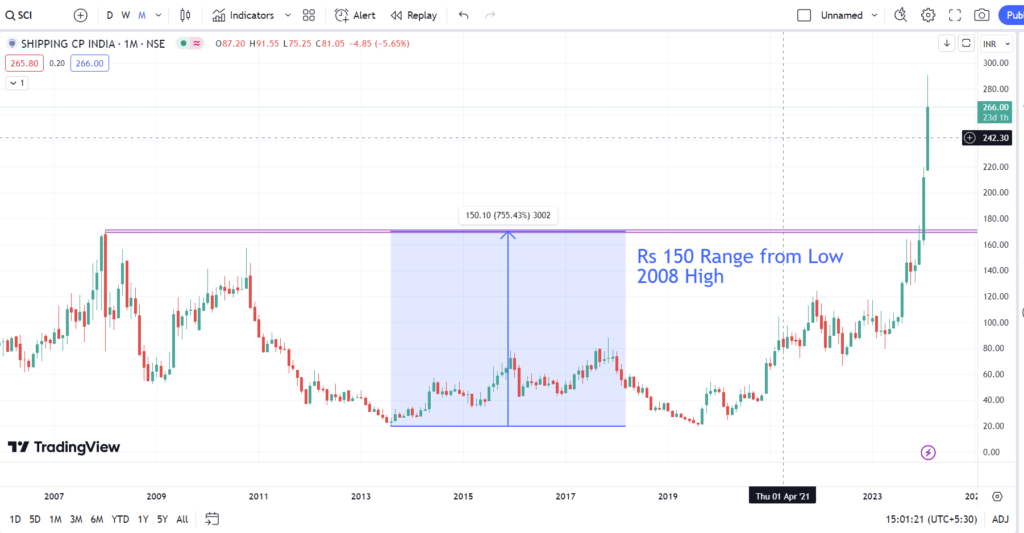
Market has moved around Rs 150 from low to its previous all time high price [ which was happened in 2008].
So, we can expect the same price movement after the breakout.
Our entry price is Rs 220 [ buy the stock only after it crosses the high price of closing candle. Once the February 2024 candle crosses Rs 220, we will enter into the stock. So our entry price is Rs 220.
So the next important question , What is the exit price ?
Exit Price : Entry Price + Rs 150
: 220 + 150
Rs 370
So our Target or Exit price is Rs 370.
Note : Stock market is very dynamic and its a probability game. Stock may move in our direction or against our entry. So you should be mentally prepared for the outcome, may be positive or negative.
If the stock price moves against our direction, take small loss and exit from the trade. We will discuss more about stop loss in our upcoming blog posts.
Fortunately if SCI share price moves as per our prediction, try to capture major portion of the price rally.
Small losses and Big profits is the only way to earn huge fortune from Stock Market.
Also Read:
Bajajhind Share Price after All Time High Breakout
HSCL share Price prediction after All Time High breakout
Shipping Corporation of India share price Target [ Breakout on Weekly Chart ] SCI Stock Price 2024
Below is the weekly chart of SCI Stock.
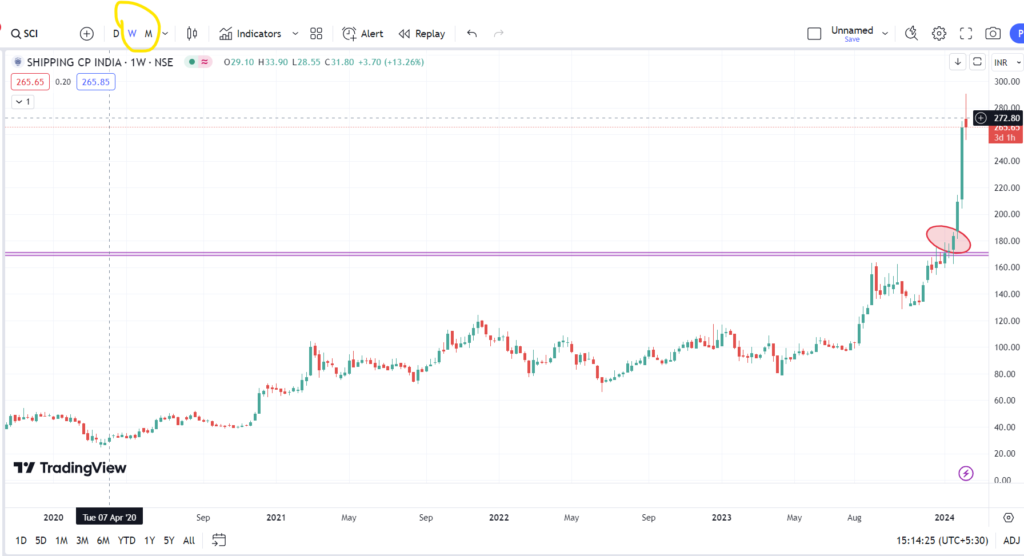
On Monthly chart our entry price is Rs 220.
If you see the weekly chart , entry price is around Rs 186.
It totally depends on your risk appetite, whether to enter the stock based on monthly time frame or weekly time frame.
If you are a aggressive person, then go for weekly chart.
Ofcourse both the entries has their pros and con’s
Hope you enjoyed reading this article. We will update this article, every week by tracking the price movement. Let’s see whether the stock will hit the target or stop loss.
Leave a Reply