In this blog post we will discuss HSCL [ Himadri Speciality Chemical Ltd ] Share price based on the monthly chart.
Below is the monthly Chart of HSCL.
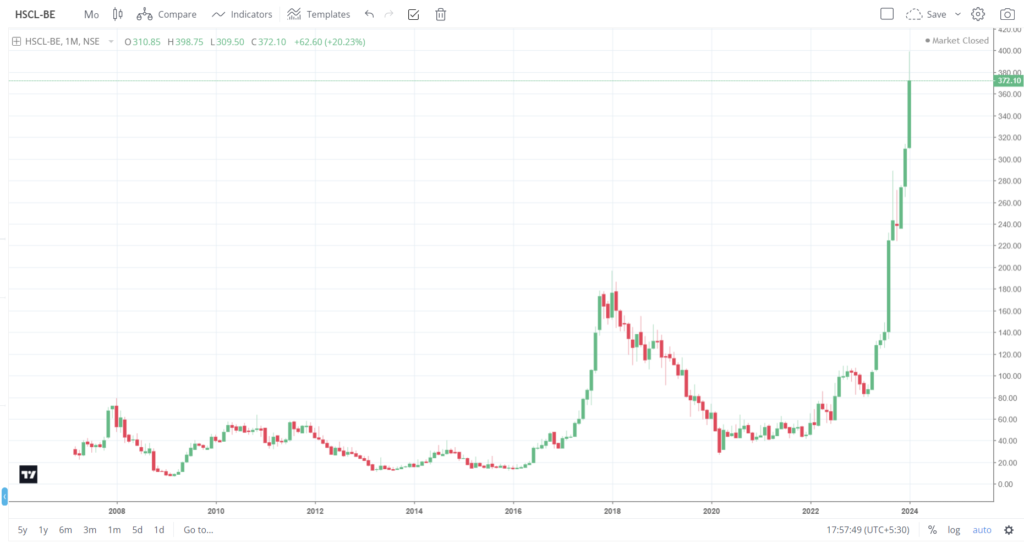
As we are looking into the larger time frames you won’t see any disturbance or noise while analyzing a stock. Any one who is planning to earn from the stock market with peace of mind then please go for higher time frames.
We will not discuss the HSCL stocks fundamentals and its business model. Just based on the Technical analysis we will see how the Himadri Speciality share price moves.
HSCL Share All Time High Break Out Strategy [ pattern ]
If you observe the above chart , it is very clear that HSCL has given opportunity only twice till date. [ based on All time high breakout pattern , that too on monthly time frame].
If you are looking for momentum stocks, then we suggest you master this strategy.
Note : Don’t buy or sell stocks based on other’s analysis. Do your own research as you are investing hard earned money in the stock.
Let’s get back to our topic..
1st Opportunity :
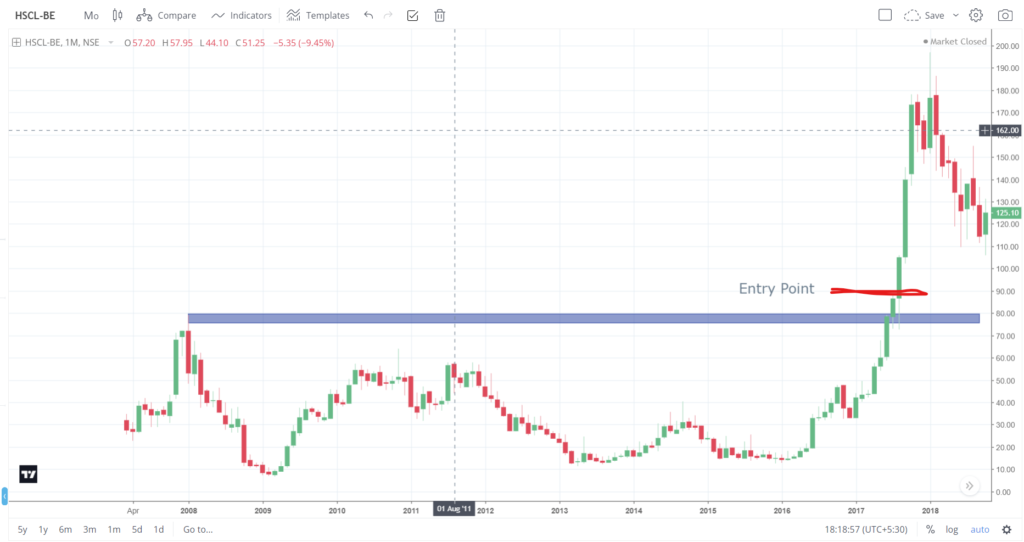
In the year 2008 HSCL has registered an all time high price of Rs 80 [Approx ]. To be precise in the month of January 2008, HSCL stock’s highest price was 79.19 Rs.
From then stock has been in downtrend and consolidation mode till 2017 July.
In the month of July 2017 stock broke all time high price Rs 79.19 and the new all time high price is Rs 88.30. [ Wait till the monthly candle closes].
Once the August month’s Candle crosses an all time high of Rs 88.30, you can punch your order.
Hope you have no doubt about the entry price.
What is the exit price ?
In my opinion, exiting the trade is even more important than entering it. If it goes in your direction then keep on trailing or hold it till your target.
Unfortunately if your strategy fails and stock moves in the opposite direction, then it is better to exit the stock. We recommended you to put a fixed stop loss. Anyway we will explain where to put the stop loss or exit the stock, while analyzing another stock. As, HSCL stock in both opportunities, didn’t hit stop loss.
HSCL target Price should be :
Make use of the charting software to fix your target price and Stoploss. [ As we have earlier said we will discuss Stop Loss in another article].
In the Charting software you will see an option “Price Range” tool. Click on the tool and mark the range. Range should be New All Time High Price to All time Low.
Just see the below image for easy understanding.
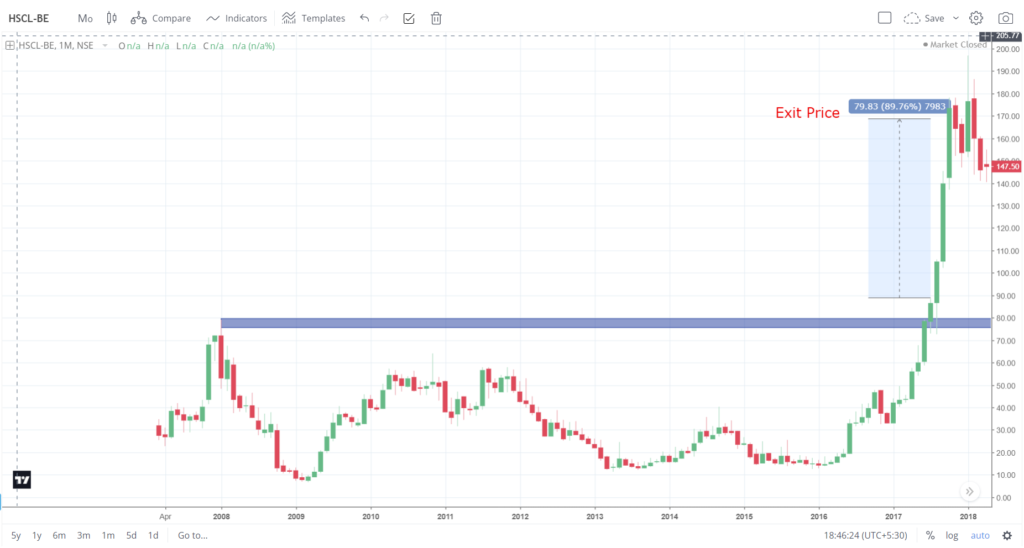
From all-time low of Rs 8 to New all-time high of Rs 88, HSCL stock price has seen growth of 80 Rs. [ 88-8 =80 Rs ].
So we can expect the stock to move in the same range after breakout.
So our target price should be : Enty Price + Rs 80
Our Entry Price : Rs 88.50
Target : Rs 88.50 + Rs 80 = 168.5 Rs
Once the stock touches Rs 168.5 you can exit the stock or you can trail the price.
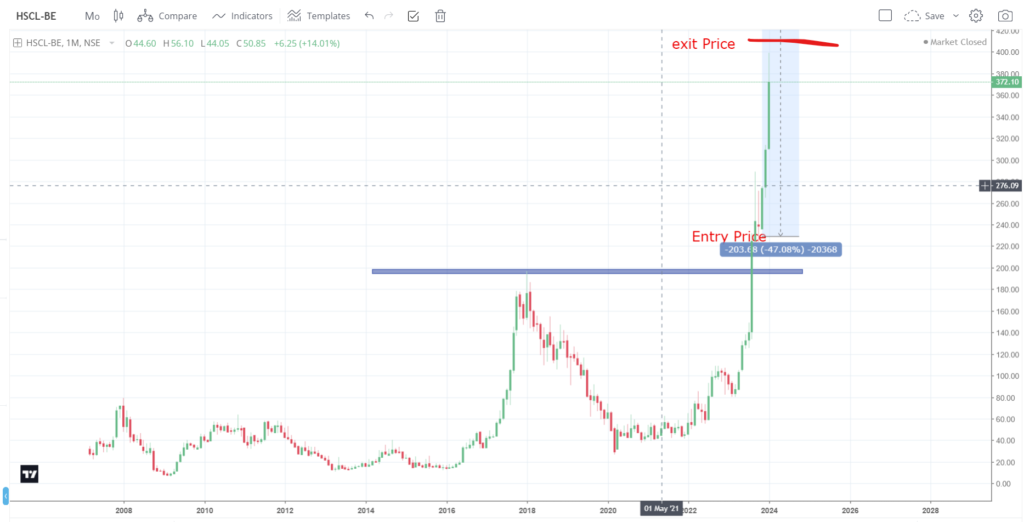
2nd Opportunity :
HSCL Stock has given another opportunity in the year 2023.
In the month of January 2018, HSCL stock has seen an all time high price of Rs 196.80. After that stock has never come near to it. As per our strategy, we will enter the stock only if it crosses the All Time High price.
Almost after 5 years of downtrend and consolidation, Stock price has successfully broken the all time high price and the new all time high price is Rs 232.
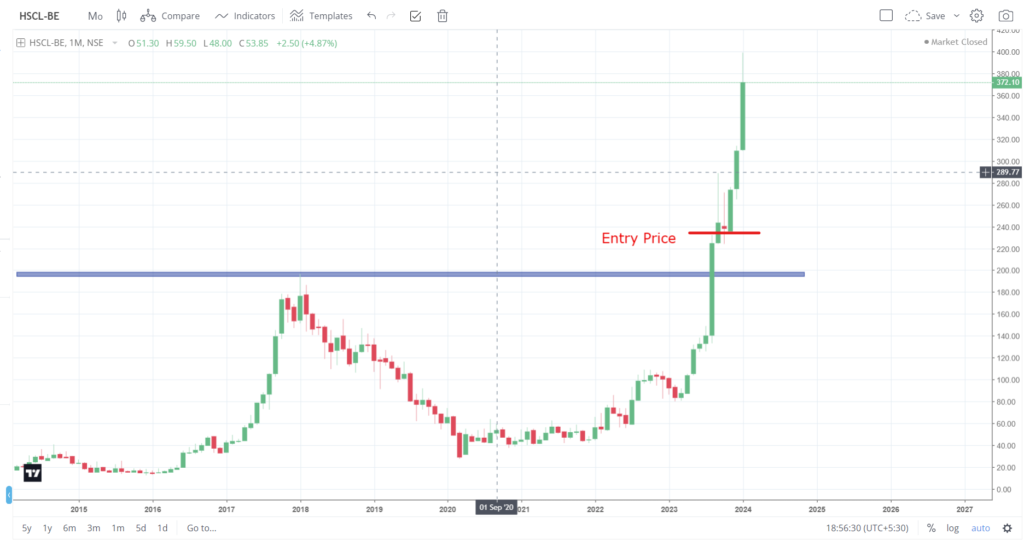
Most important thing is that the monthly candle should close above the previous all time high price. In this case the August 2023 candle has closed above Rs 196.80 [ previous all time high price].
So our strategy is, once the September month candle price crosses the new all time high price rs 232, we will enter the trade.
As the entry point is clear and now we will see what the exit point is ?
Target Price : Entry Price + [ Difference between Entry Price and All time Low in the Second Opportunity ]
Target Price : 232 + [ 232 – 52]
Target price : 412
Once the HSCL share price reaches the target, you can exit it or trial it. It’s up to you.
HSCL 2024 & 2025 target Price [ Prediction ]
Predicting a stock price is waste of time. I have seen many blog’s predicting HSCL share price for the year 2024, 2025 2030 etc.
You can predict share price after a pattern formation. As per our strategy we can predict HSCL share price.
HSCL 2024 or 2025 target price : Rs 410
Keep on trialing the Price, once the your target reached. Who knows even the stock can Rs 1000 by the end of 2025 and Rs 2000 by 2030. [ Just kidding ].
Follow rules very strictly.
Leave a Reply