In this blog post we will discuss about the opportunity given by Delhi Land & Finance ltd [ DLF ] Share after many years of consolidation.
DLF is a real estate development company started in the year 1946 by Chaudhary Raghvendra Singh. DLF ltd is headquarted at New Delhi, India.
As we are dealing with technical analysis of DLF stock, lets stick to it. In this article We will not cover information on fundamentals like PE ratio, Dividend, debt to equity ration, market capitalization etc. So without further ado lets start DLF share price analysis and prediction based on price action.
DLF Share Price Prediction based on 15 Year Breakout Pattern
In the month of July 2007, DLF shares were listed on both NSE and BSE. To be precise DLF shares were listed on July 5th, 2007.
IPO price band for DLF has been set at ₹500 to ₹550 per share with a mimimum lot size of 10 shares.
Lets get back to our topic…
After successfully listing, DLF stock price has skyrockted and has reached almost Rs 1200 with in no time. We all know about 2008 stock market crash and DLF was one of the major stock effected in this crisis.
From Rs 1200 to stock price has almost reached to Rs 135 with in 1.5 years. In the month of February 2009, DLF stock has reached all time low of Rs 124.
After that, DLF stock has seen a small upmove and it tried to break its listing price but it couldn’t. Rs 530 range acted as a major resistance level and the stock has again seen a drown trend.
From 2008 August to September 2023, stock couldn’t break the resistance zone. [ Its almost 15 years of consolidation phase].
As per our Breakout strategy [ More the consolidation time, more powerful the breakout would be ] we got entry into this stock after 15 years i.e. in the month of October 2023.
Lets have look at the image below [ for your understanding ]
DLF Share Price Chart [ Monthly Time Frame ]
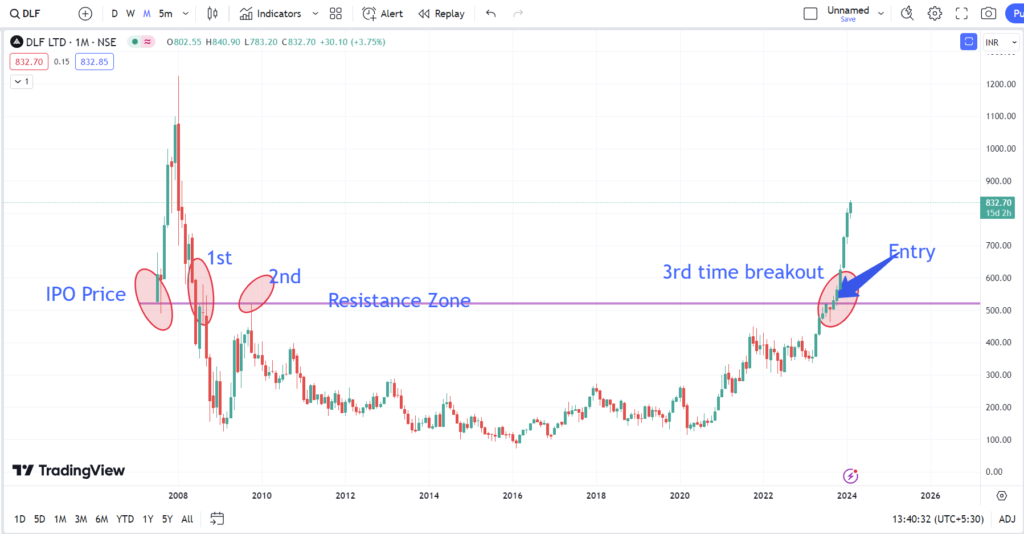
In the above image you can see :
1st Resistance
2nd Resistance
and the breakout happened in the 3rd attempt.
In the month of September 2023, Resistance broke and the monthly candle closed successfully above the zone.
As per the breakout strategy, entry would be , once the October month candle crosses the high of September month candle.
Rs 544 is the high of September month candle. Once price crosses Rs 545 , we can initiate our trade,
Entry Price: Rs 545
So what is the exit price or Target as per the strategy ?
Target : Entry Price + [ Difference of Resistance zone – Low ]
Check the below image once..
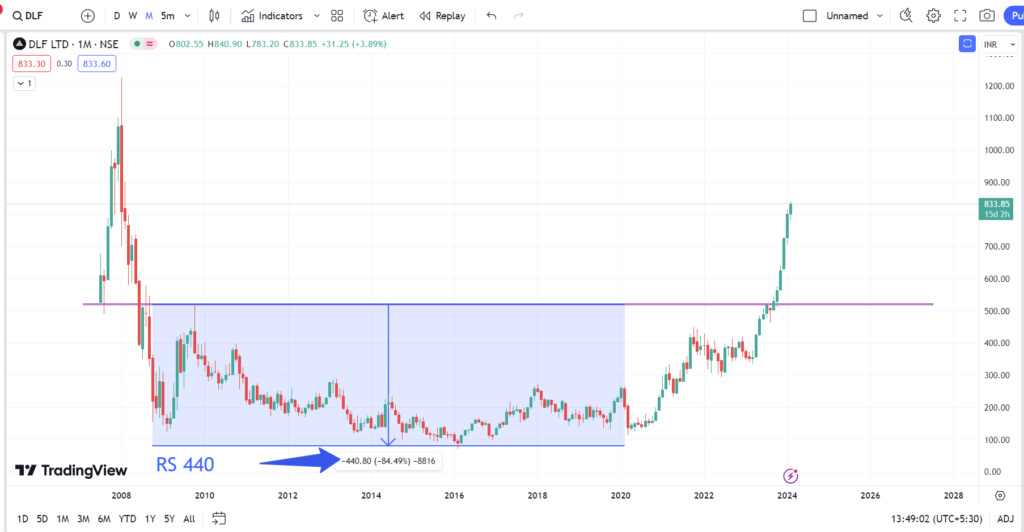
Rs 440 is the difference between Resistance zone and All time Low price.
So our initial target would be :
Target : Rs 545 + Rs 440
: Rs 995
Once the Target is achieved, you can exit the trade or trail it. It totally depends on your investment strategy.
Unfortunately, if the stock price moves against your prediction, then you should exit the stock with minimum loss.
Exit Price : Low of resistance zone Breakout Candle [ September month Candle ]
In this case low is Rs 500. If the price breaks below Rs 500 , then it is recommended to exit the Stock.
Conclusion : On Monthly time Frame, DLF has given only opportunity till date based on breakout strategy. As on writing this article [ February 14th, 2024], DLF stock has increased 55% after breakout, and that too in the span of 5 to 6 months.
Leave a Reply