KEC International was incorporated in the year 2005 and is listed on both NSE and BSE.
Similar to earlier blog posts on all time high breakout pattern, you will definitely love this blog post.
Here on this page we will cover “How many opportunities KEC Share has given till date based on all time high breakout pattern” and about the latest opportunity it has given.
KEC International Share Price Monthly Chart All time High Breakout : 1st Opportunity

Above image: KEC Share on Monthly Time Frame
Note : More the consolidation of the price , more stronger the breakout would be. In general we will consider at least 3 years of consolidation, as we look for high probability investment opportunities.
KEC share has touched ₹ 189.4 in the month of January 2008. From there on the stock has never seen that price for almost 9 years.
After 9 years of downtrend and consolidation, the KEC stock price has finally managed to break the previous all time high price i.e. ₹ 189.4 in the month of March 2017.
Monthly Candle [ March] successfully closed above the previous all time high price and closing price was ₹ 208.60.
As per our strategy, once the next month candle crosses the high of march month candle, we will punch the order. In this scenario the all time high price is ₹ 212.90. So logically our entry price is ₹ 213.
Entry , Exit and Target :
Three things are very important in stock market while planning for short term or long term investment. At least you should consider the below mentioned tips for short term investment.
- Entry Point : Entry Price of the stock
- Exit : If the stock goes against your direction, then you should exit the stock. [ Technically you can call it as stop loss].
- Target : If stock movement is as per your prediction, then you should a target when to exit the stock.
As per the strategy the entry point is clear. Now lets find out what is the exit price and target price.
Exit Price : Your stop loss should be low of the entry candle. In this case, exit price is low of the march candle i.e. ₹ 161.50.
Target : First get the all time low price in the range i.e. from previous all time high to latest all time high.
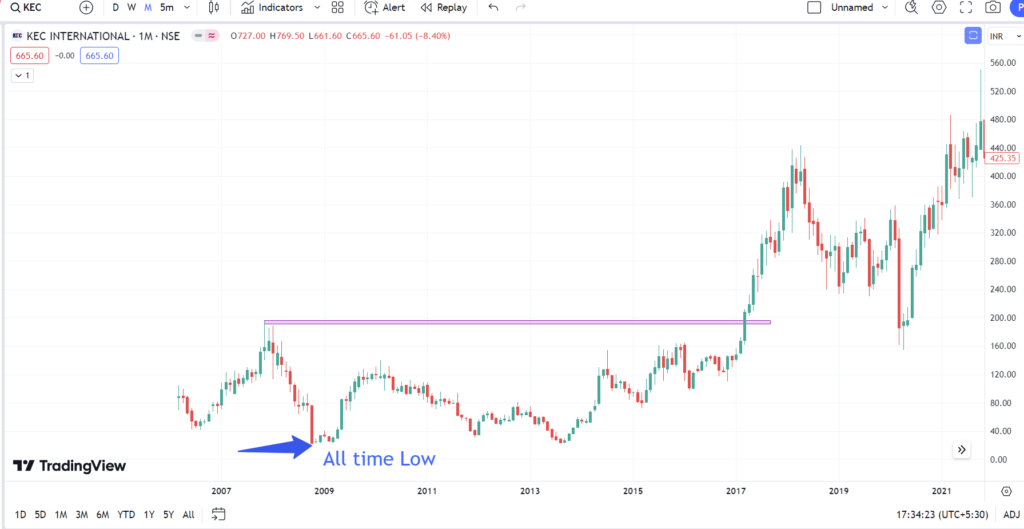
Above image : All time low price of KEC share price.
Now the target is : Entry Price + [ Previous All time high Price – All Time Low Price]

From the above image you can clearly see the difference between previous all time high price and all time low price i.e. ₹ 172.60
So our target would be :
Target : Entry Price + 172.60 ₹
Target : 213 + 172.60 ₹
: ₹ 386 [ Approx]
Once the stock reaches the target, you can exit it or you can trial the exit price and hold the stock for long term.
It all depends on your investment strategy and your risk apetite.
Leave a Reply